

내 서버는 debian Wheezy 및 htop 1.0.1에서 실행되고 있지만 대시보드에는 CPU의 100.0% 값을 제외하고는 어떤 값도 표시되지 않습니다.
미터 값을 항상 표시할 수 있습니까?
이것은 내 서버의 현재 htop 표시입니다.

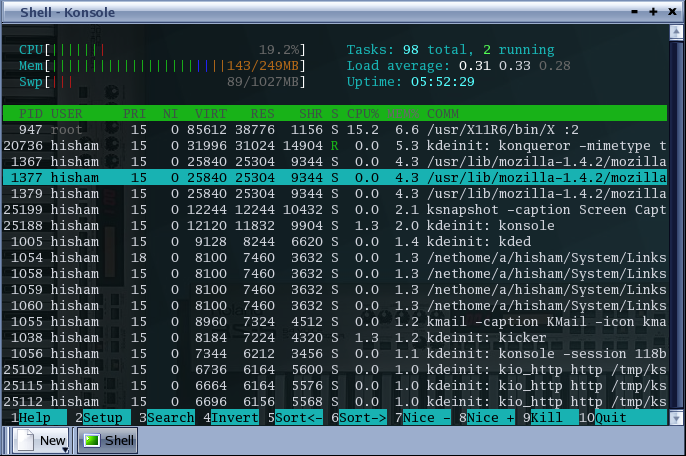
하지만 아래 스크린샷처럼 측정기에 숫자가 항상 표시되기를 원합니다.https://hisham.hm/htop/index.php?page=screenshots:
내 htoprc는 ~/.config/htop/htoprc에 있으며 다음 데이터를 포함합니다.
# The parser is also very primitive, and not human-friendly.
fields=0 48 17 18 38 39 40 2 46 47 49 1
sort_key=46
sort_direction=1
hide_threads=0
hide_kernel_threads=1
hide_userland_threads=0
shadow_other_users=0
show_thread_names=0
highlight_base_name=1
highlight_megabytes=1
highlight_threads=0
tree_view=0
header_margin=1
detailed_cpu_time=0
cpu_count_from_zero=0
color_scheme=0
delay=15
left_meters=LeftCPUs2 CPU Memory Swap
left_meter_modes=1 1 1 1
right_meters=RightCPUs2 Tasks LoadAverage Uptime
right_meter_modes=1 2 2 2
답변1
나에게 문제는 터미널이 아니라 ~/.config/htop/htoprc터미널의 색 구성표입니다.
htop의 기본 색상 모드를 사용하여 Konsole에서 One Dark 테마를 사용할 때 이 문제가 발생했습니다.
두 가지 솔루션이 있습니다.
- 터미널 색 구성표 변경
- htop 색 구성표 변경:
F2 → Colors → [x] Something different that you like!
바꿨더니 이제 숫자가 보이네요.
답변2
글쎄, 당신은 htoprc 파일을 만듭니다. 내 파일은 ~/config/htop/htoprc에 있습니다. Ubuntu에서 어떻게 작동하는지 모르겠지만 그것도 작동할 것입니다.
내부에는 다음을 입력하면 됩니다.
left_meters=AllCPUs Memory Swap
left_meter_modes=1 1 1
그러면 원하는 결과가 나올 것입니다.
color_scheme 번호를 변경할 수도 있습니다. 어쩌면 배경이 숫자와 같은 색일 수도 있습니다.